PROJECT 004 · INFRASTRUCTURE OPERATIONS
> cat laxstack-platform.md

Turning My Home Infrastructure Into a Private Network Operations Center.

A live dashboard for the OPNsense firewall, Proxmox hypervisor, and AWS accounts I run day to day — with a public telemetry snapshot for anyone who visits, and a fully authenticated operations view behind Amazon Cognito for me. Serverless end to end: API Gateway, Lambda, DynamoDB, SNS, and an EventBridge-driven alerting pipeline that watches gateway health independently of the dashboard itself.

live — dual-tier access cognito oauth2 + pkce serverless: lambda + api gateway event-driven gateway alerting
Open Live Platform View Backend Repo Back to Portfolio
cat why-build-this.md

Why Build This?

My homelab already runs real infrastructure — an OPNsense firewall handling multiple WAN uplinks and gateways, a Proxmox cluster hosting a mix of VMs and containers, and two AWS accounts for cloud-connected experiments. Checking on all three meant three different logins and three different mental models. There was no single place to just look and know the state of things.

The engineering goal wasn't just a status page — it was to design something with real access boundaries: a version that's genuinely useful to a visitor with zero credentials, and a meaningfully deeper version that only unlocks after proving who I am. That split shaped almost every other decision in the project, from how the backend is authorized down to what the frontend is allowed to poll.

It was also a deliberate excuse to build a complete, production-shaped serverless product — OAuth2/PKCE, a JWT-authorized API layer, and independent backend alerting — rather than another isolated lab exercise.

One Pane of Glass

OPNsense, Proxmox, and two AWS accounts, unified into a single dashboard instead of three separate logins.

Real Access Boundaries

Not a toggle — a genuinely different product depending on whether you're signed in, enforced at the API layer, not just the UI.

Production Shape

OAuth2/PKCE, a JWT-authorized API, and autonomous backend alerting — the same shape as a real product, not a lab toy.

cat design-decisions.md

System Architecture

Four decisions shaped the backend before a single line of frontend code was written.

01Serverless-first: API Gateway + Lambda, nothing to patch
02Cognito in front of every protected route, never the browser alone
03VPC Endpoints instead of a NAT Gateway for AWS service calls
04Private VPC connectivity to on-prem OPNsense & Proxmox APIs
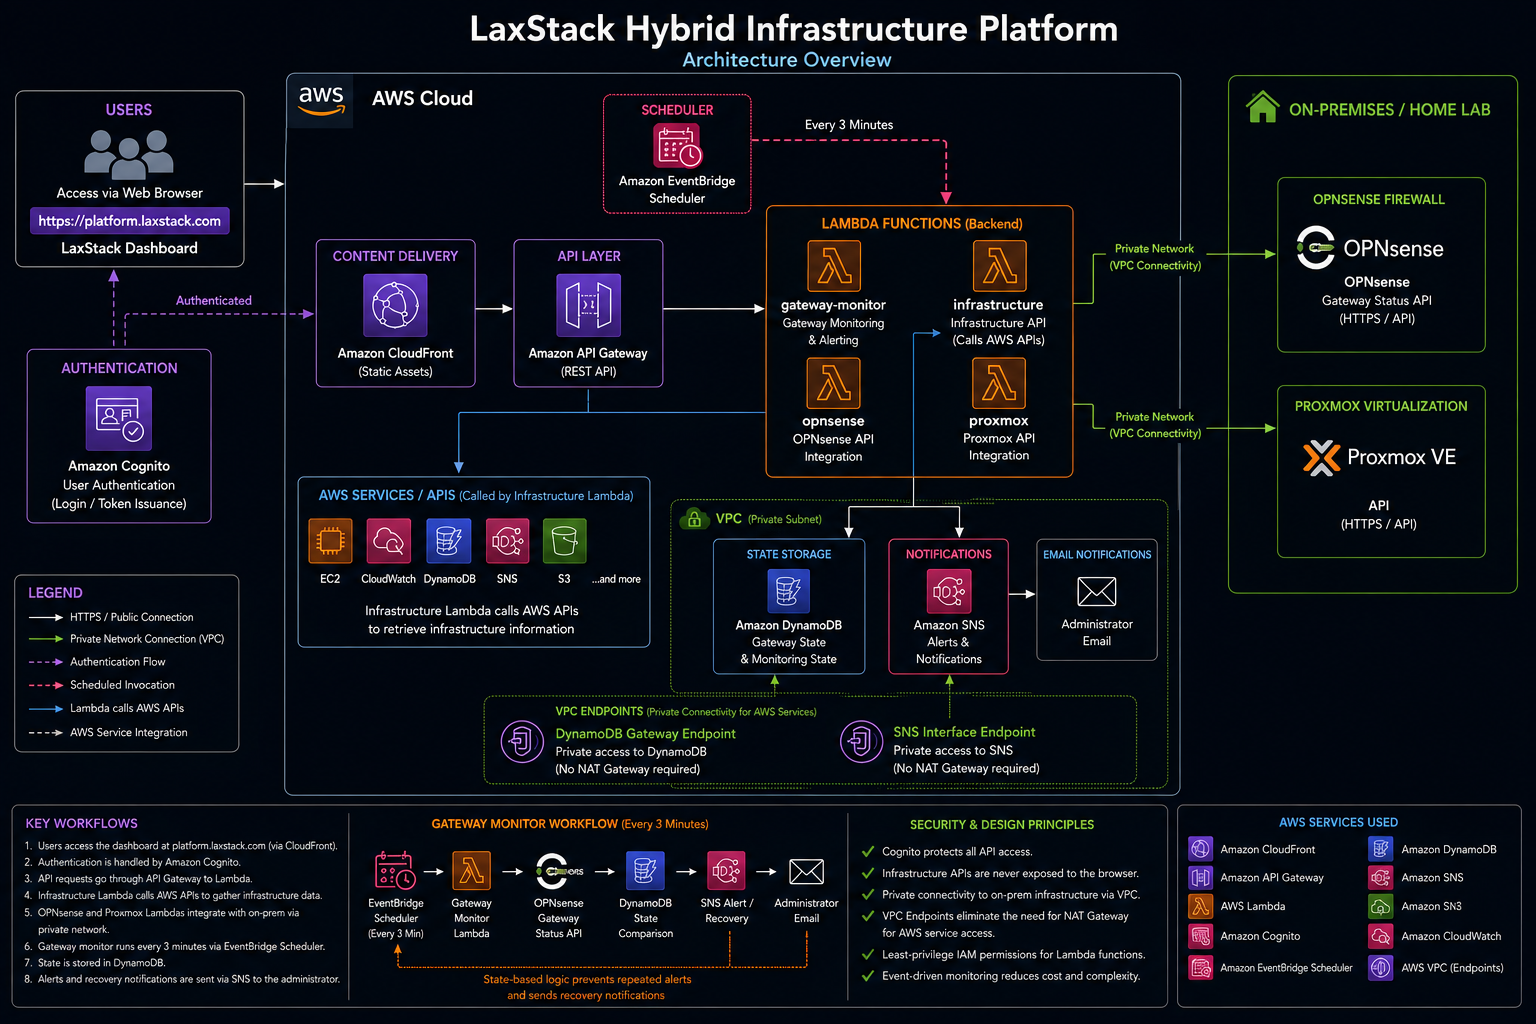
Architecture diagram showing users hitting CloudFront and API Gateway, Cognito handling authentication, four Lambda functions (gateway-monitor, infrastructure, opnsense, proxmox), an EventBridge Scheduler triggering gateway-monitor every 3 minutes, DynamoDB for state, SNS for email alerts, VPC Endpoints for private AWS access, and a private VPC connection out to the on-prem OPNsense firewall and Proxmox host.
whatFour purpose-built Lambda functions behind a single API Gateway: one per infrastructure domain, plus a fifth EventBridge-triggered function dedicated to gateway monitoring.
whySplitting by domain keeps each function's IAM policy narrow — the OPNsense Lambda has no reason to touch AWS APIs, and the AWS infrastructure Lambda has no reason to reach into the VPC.
stageArchitecture · full request & alerting path

The console side, behind the diagram:
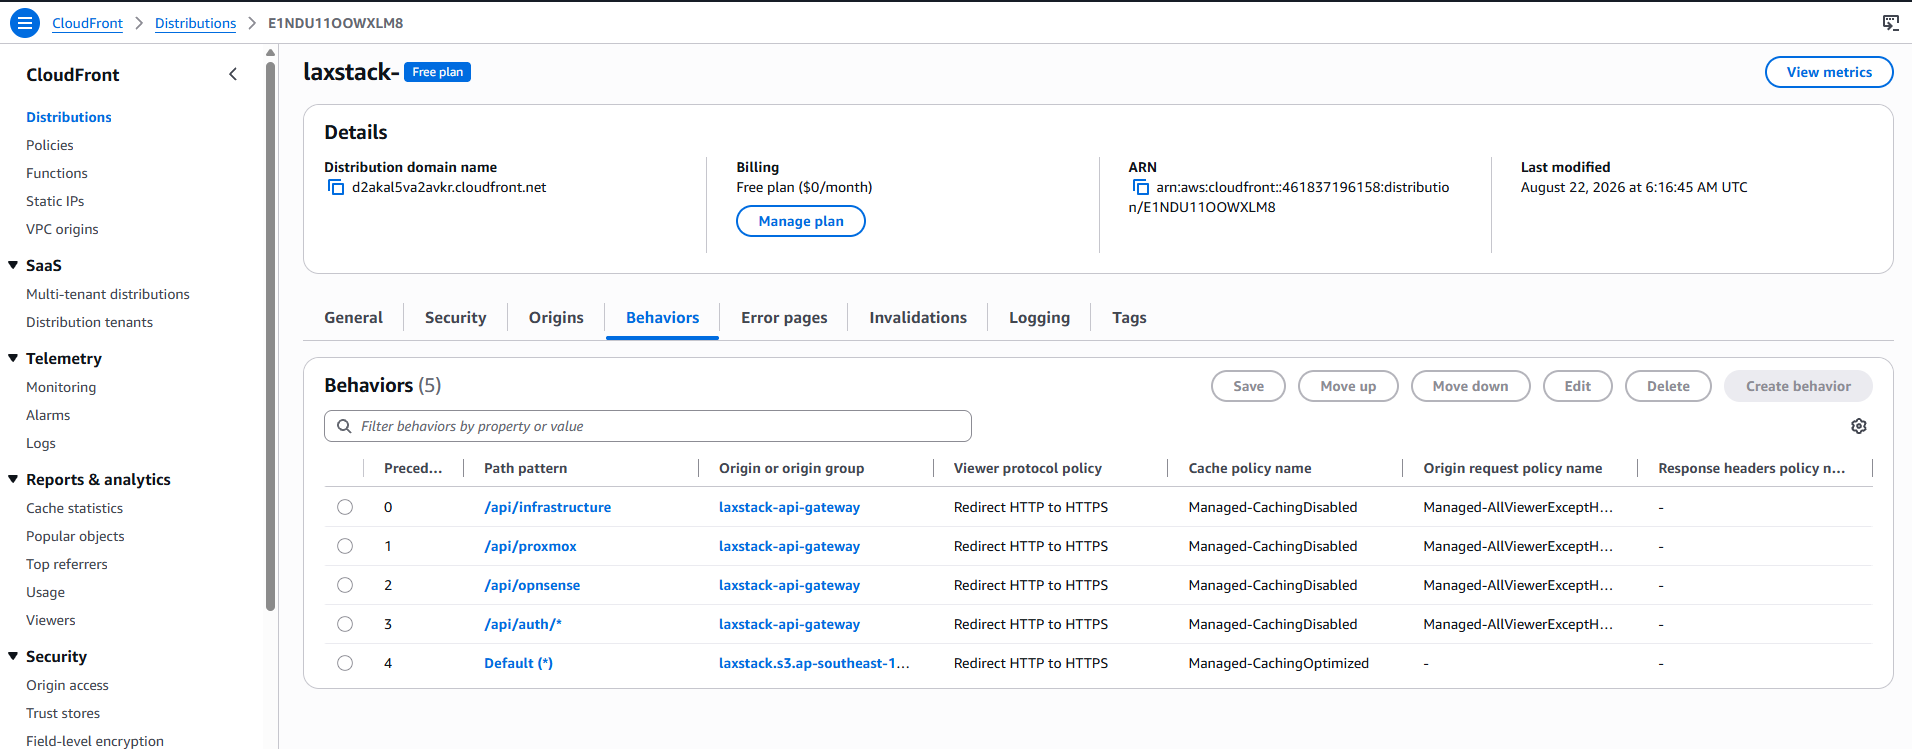
CloudFront distribution behaviors panel showing /api/infrastructure, /api/proxmox, /api/opnsense, and /api/auth/* all routed to an API Gateway origin, with the default path routed to the S3 static origin.
whatOne CloudFront distribution serving both the static frontend and every API route — same origin, no CORS to manage.
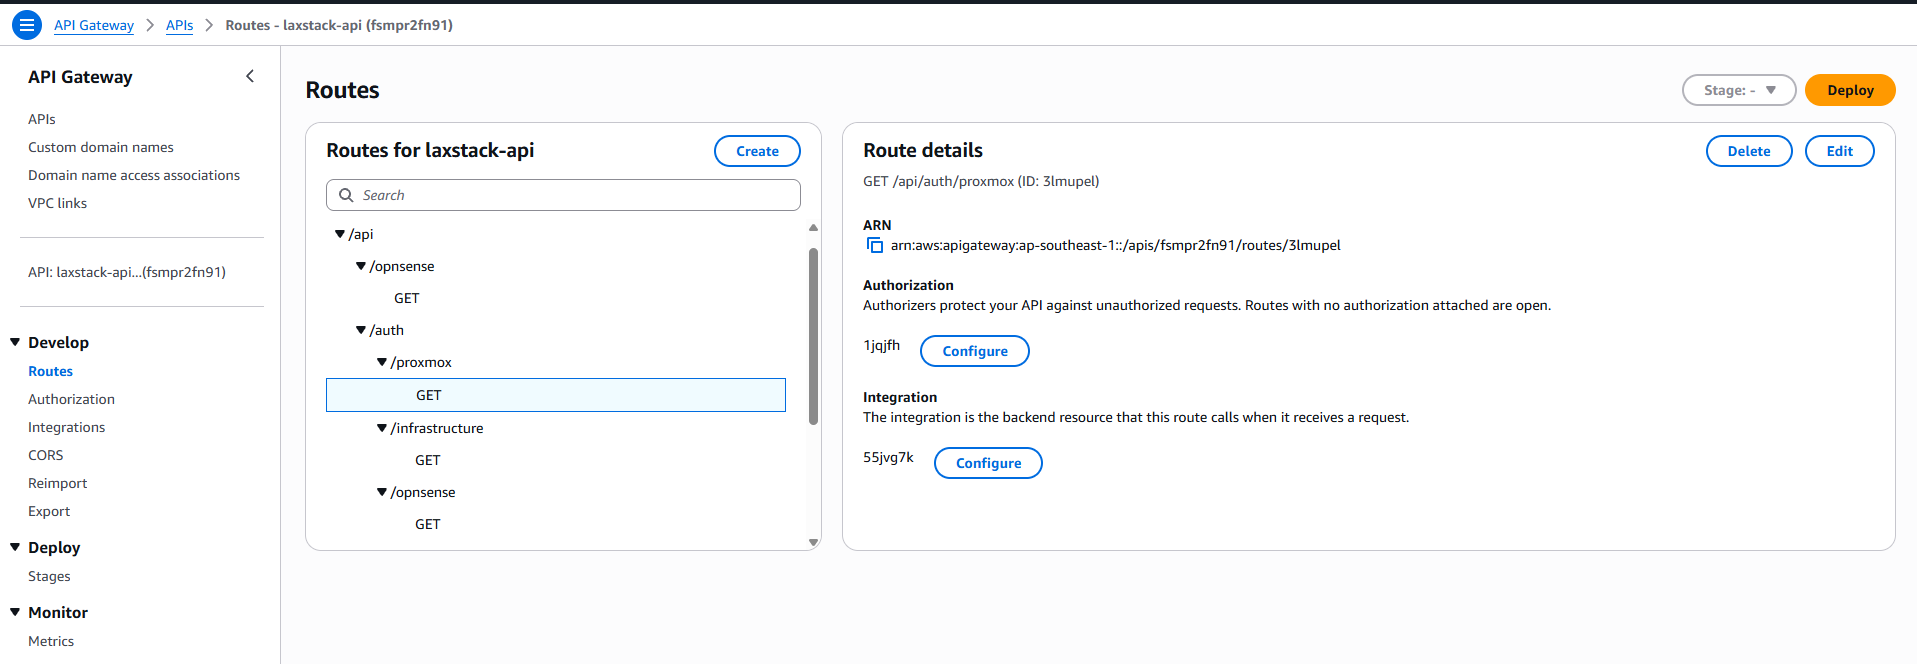
API Gateway routes panel showing a public GET /api/opnsense route alongside JWT-protected GET routes under /api/auth/proxmox, /api/auth/infrastructure, and /api/auth/opnsense.
whatPublic routes live outside /auth; every protected route sits behind a JWT authorizer validating Cognito-issued tokens.
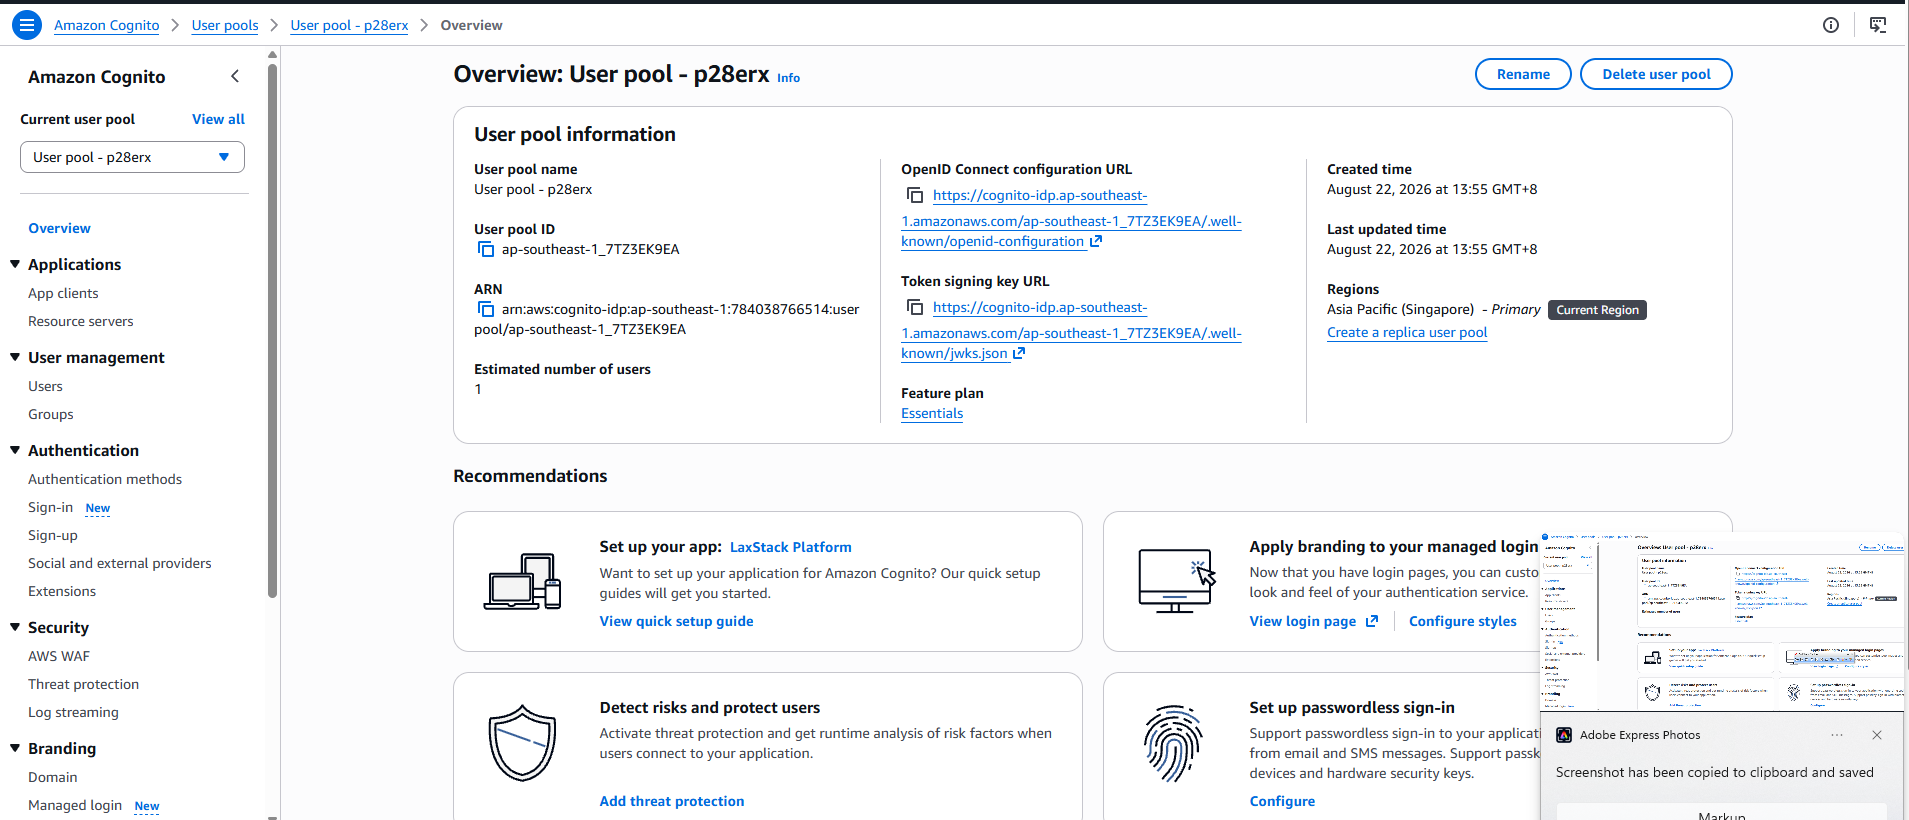
Amazon Cognito user pool overview panel showing the user pool ID, OpenID Connect configuration URL, and token signing key URL used by the JWT authorizer.
whatThe Cognito user pool issuing tokens via OAuth 2.0 Authorization Code + PKCE — no client secret, public client, browser-safe by design.
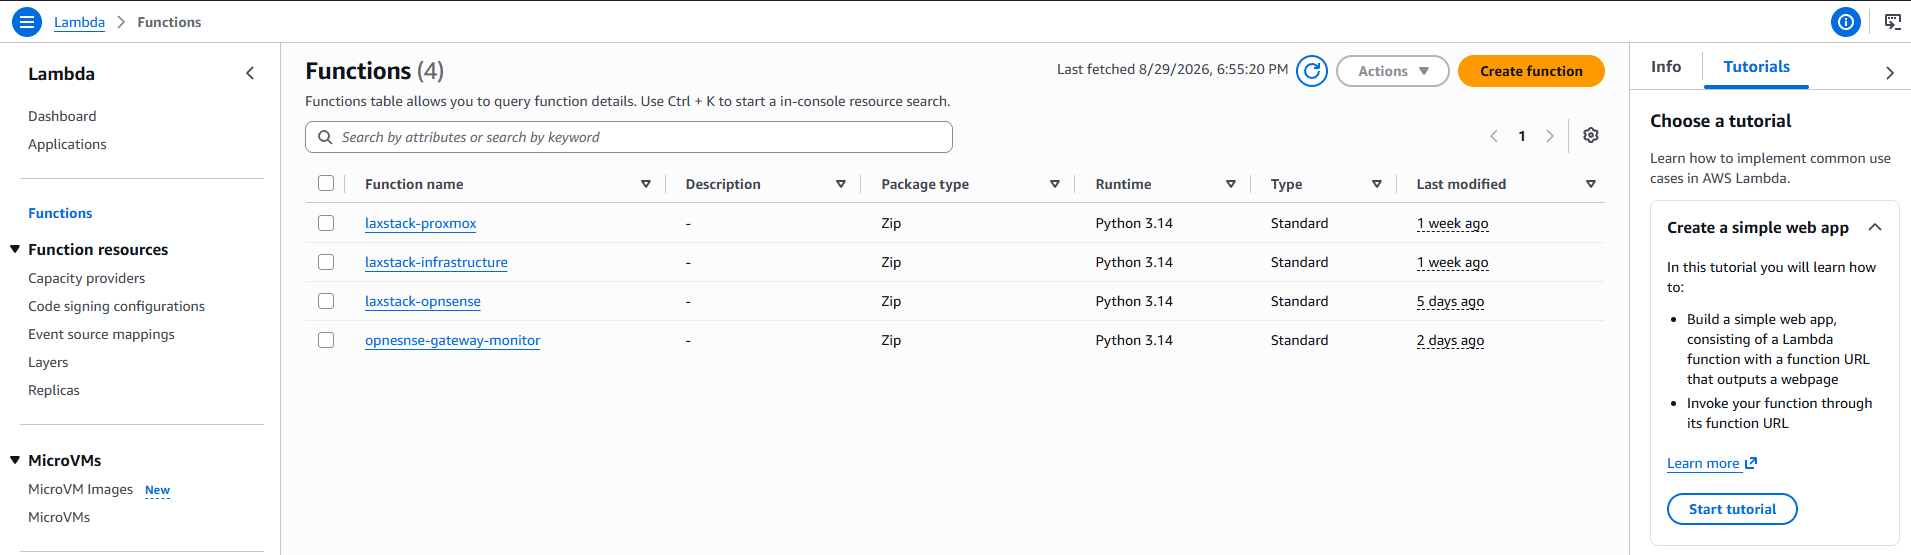
AWS Lambda functions list showing four Python 3.14 functions: one for Proxmox, one for AWS infrastructure, one for OPNsense, and one for gateway monitoring.
whatFour independent Python 3.14 functions — each one owns exactly one integration, nothing shared, nothing tangled.
show access-model

A Dashboard With Two Real Tiers

The difference isn't cosmetic — it's enforced by what the API layer will actually authorize.

Anonymous Visitor

  • Public telemetry loads immediately, no login required
  • No automatic polling — a snapshot, not a live feed
  • 3 manual refreshes per session, then hard-capped
  • Calls only the unauthenticated /api/* routes

Authenticated Operator

  • Signs in via Amazon Cognito (OAuth2 + PKCE)
  • Network & compute auto-poll every 3 minutes
  • Cloud infrastructure refresh is deliberately manual-only
  • Full NOC view: live topology, gauges, trend history, event feed
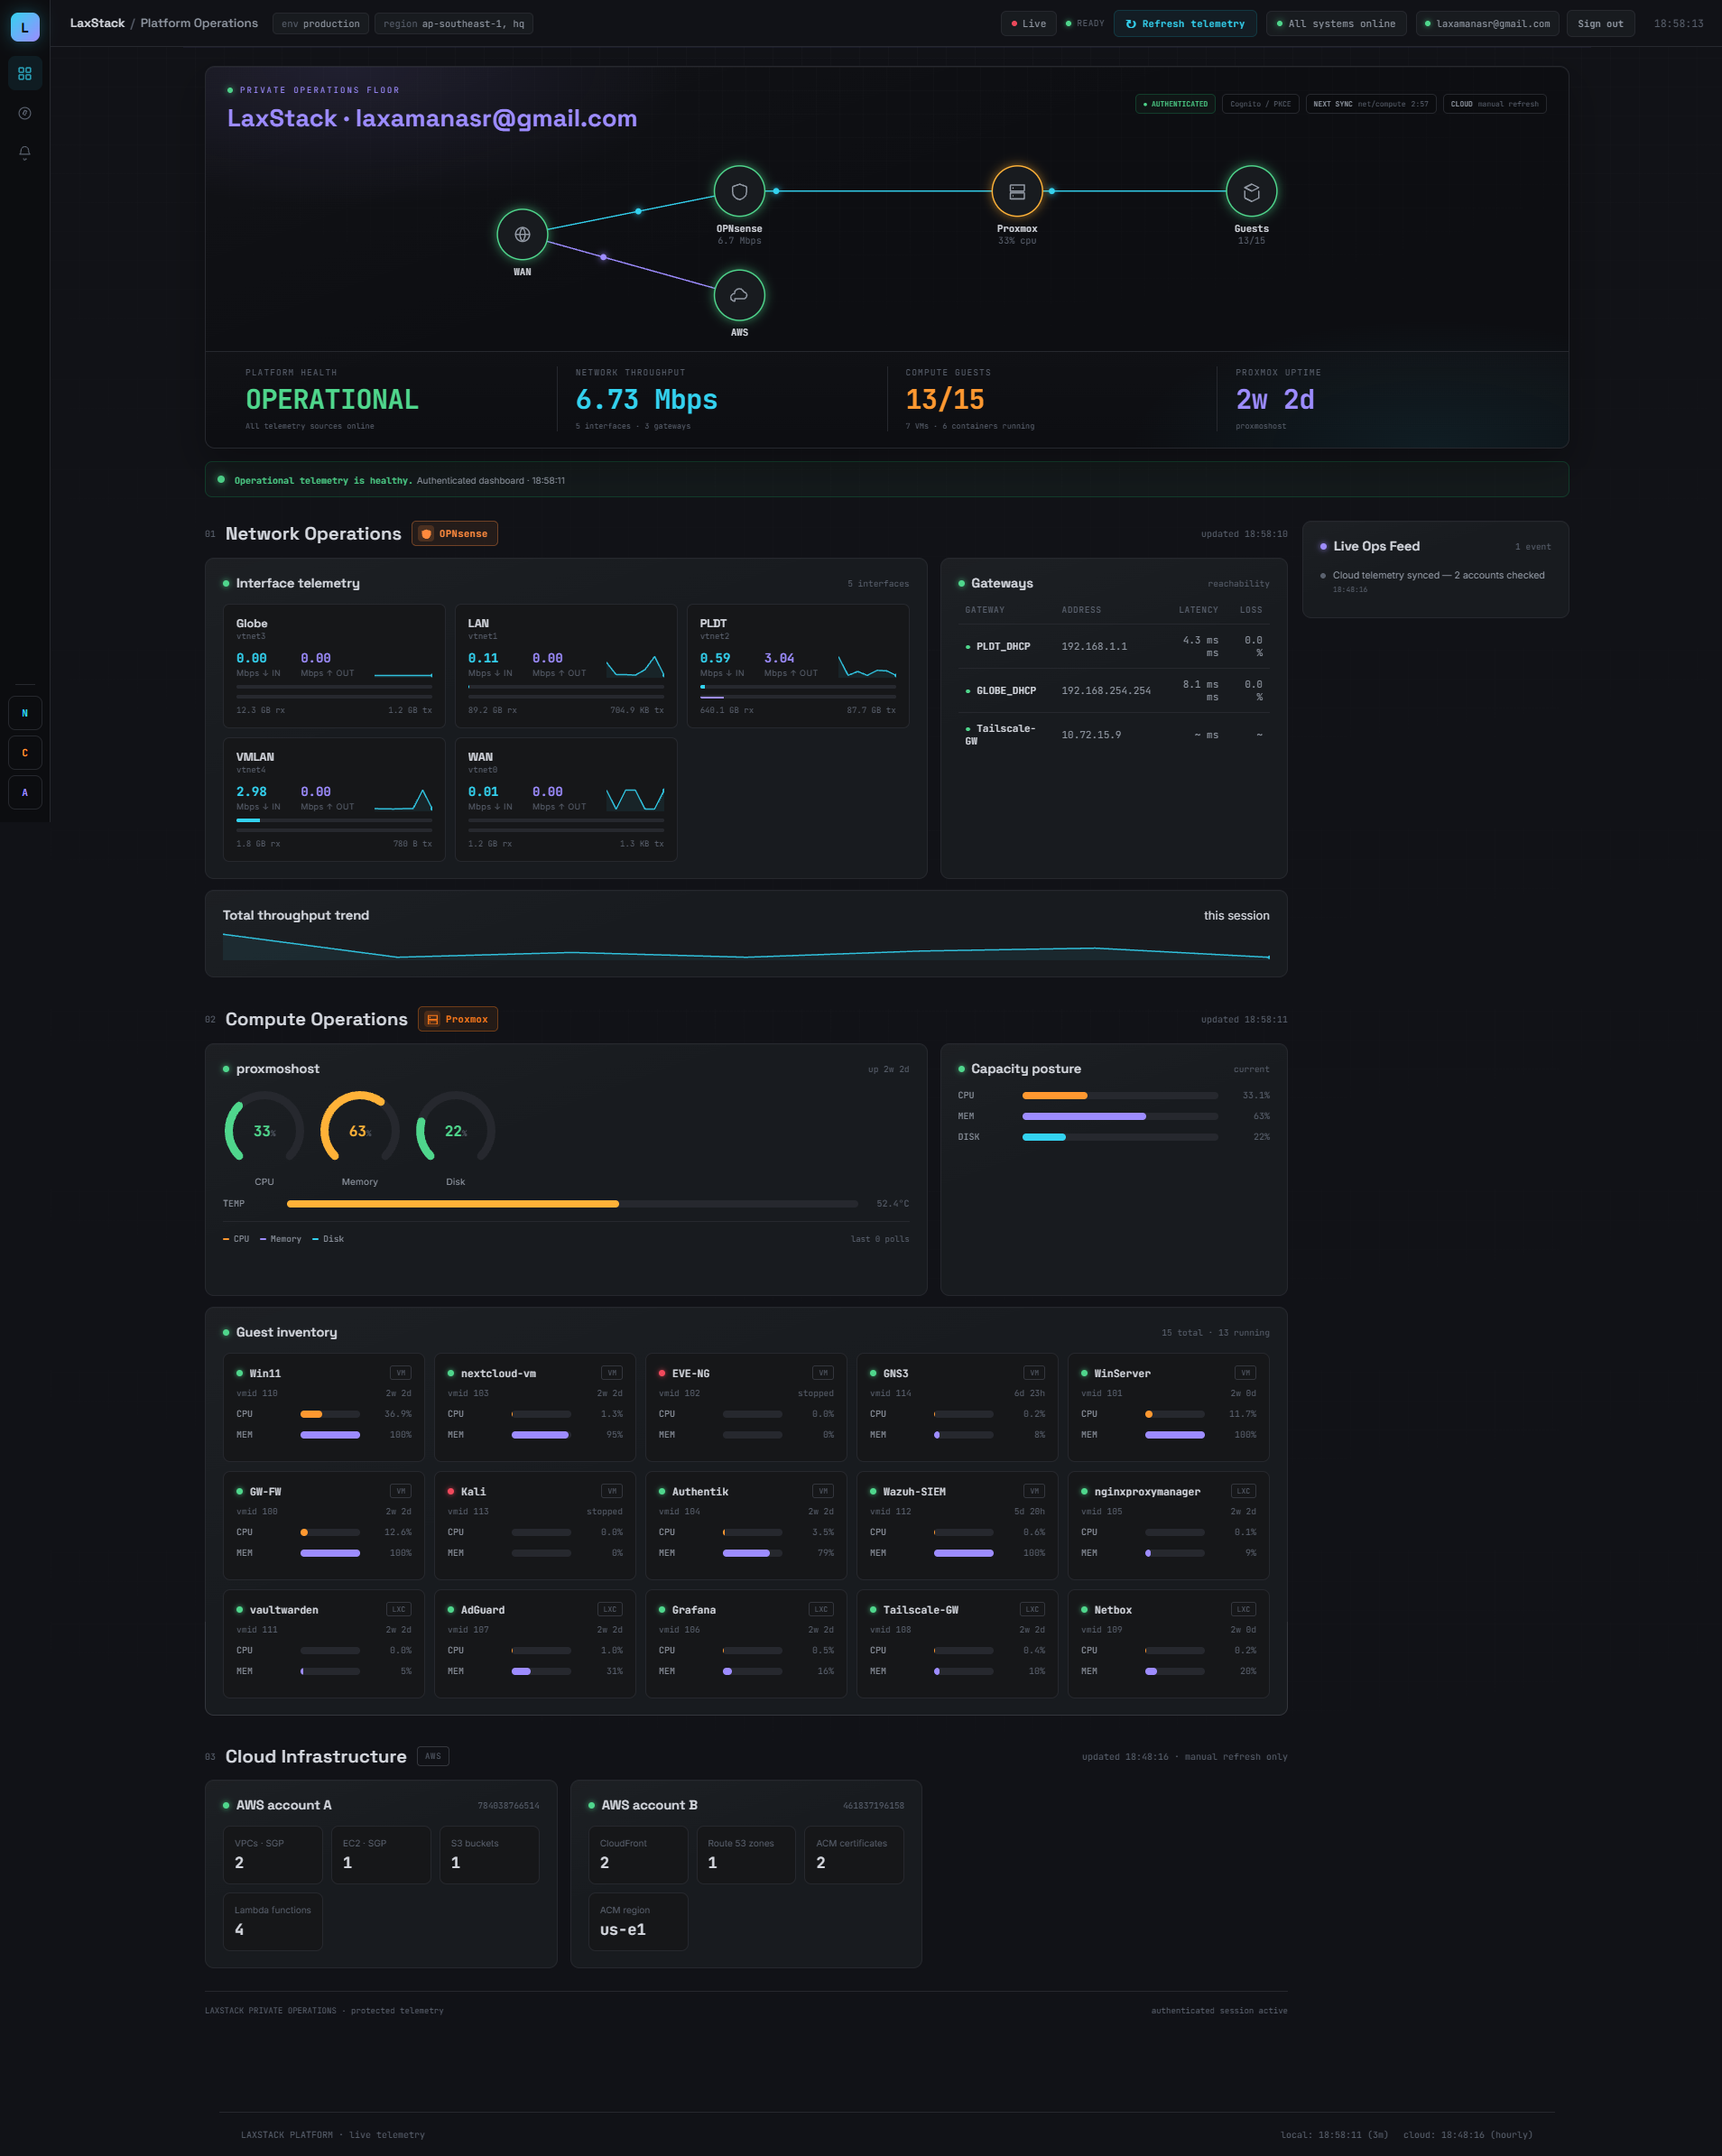
The authenticated LaxStack Platform dashboard: a live topology diagram connecting WAN, OPNsense, Proxmox, Guests, and AWS; a ticker showing platform health, network throughput, compute guests, and Proxmox uptime; network interface tiles; a gateways table; Proxmox capacity gauges; a guest inventory grid; AWS account cards; and a live ops feed logging real telemetry changes.
whatThe authenticated view: a live topology diagram, radial capacity gauges, per-interface tiles, and a Live Ops Feed that logs real state changes — gateway flaps, guests starting or stopping, capacity crossing into critical — built entirely by diffing consecutive polls client-side.
whyNothing here is fabricated for effect: every number, every feed entry, and every node color on the topology traces back to an actual API response.
stageFrontend · authenticated operations view
show running-config | section alerting

Gateway Monitoring Runs Whether Anyone's Watching or Not

A dashboard only helps if someone's looking at it. This part doesn't need anyone to be.

Separate from the interactive dashboard, a dedicated Lambda checks OPNsense gateway health on its own schedule — independent of whether the site has a single visitor or none. State is written to DynamoDB specifically so the function can tell the difference between "still down" and "just went down," which is what keeps it from paging me every three minutes for the same outage.

path — autonomous gateway alertingclick to expand
EVENTBRIDGE every 3 min MONITOR LAMBDA OPNSENSE API DYNAMODB state compare SNS on change only EMAIL
6 hops · runs on a schedule, alerts only on state change, recovers itself

State-Based Alerting

DynamoDB remembers the last known status per gateway, so a genuine outage sends exactly one alert — not one every polling cycle.

Recovery Notifications

The same comparison that triggers an outage alert also triggers a recovery email the moment a gateway comes back.

trade-offEmail-only today — Slack/Teams delivery is on the roadmap below.

Host-Level Reachability

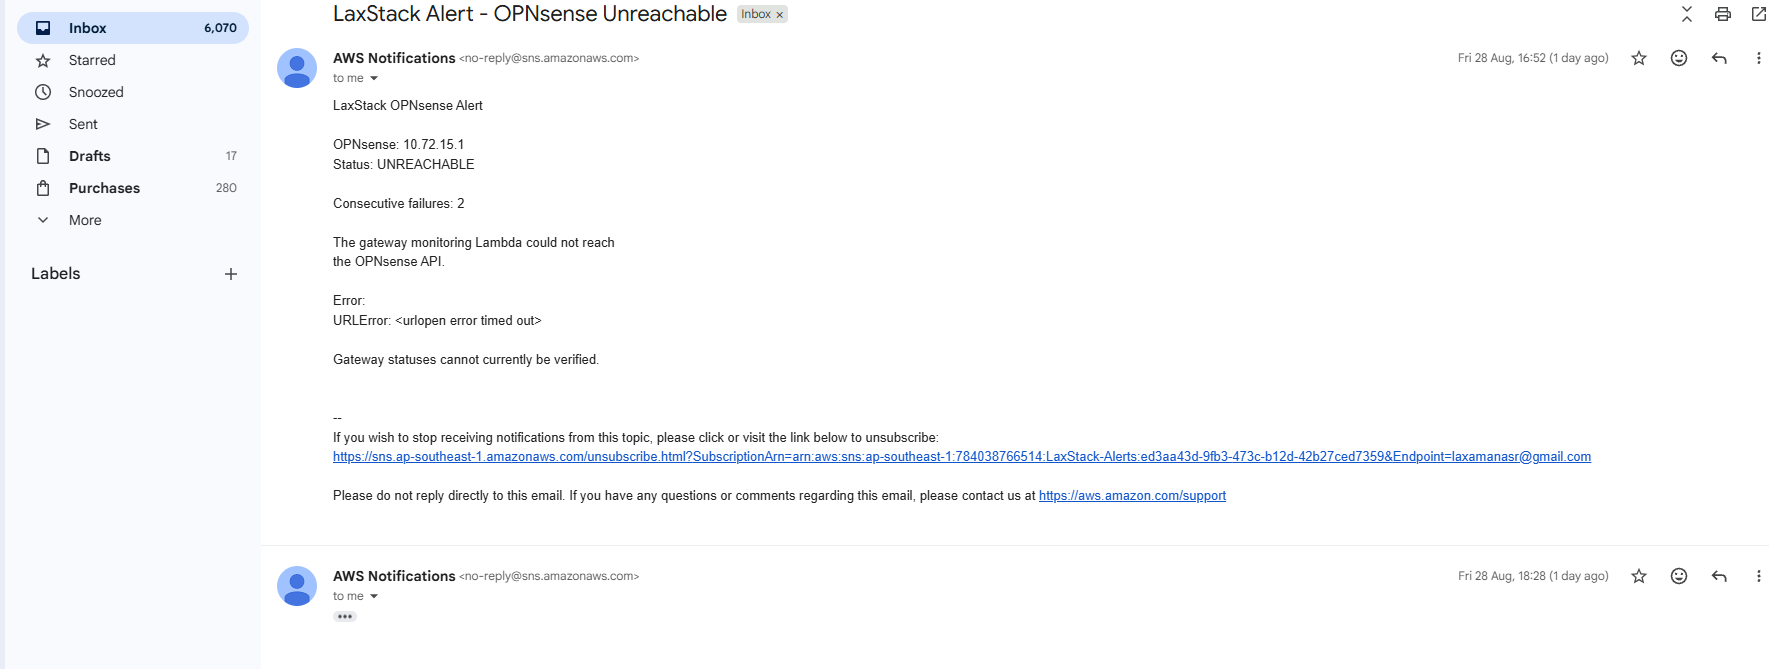
A second failure mode entirely: the monitor Lambda itself can't reach the OPNsense API. That's tracked as consecutive failures, not a single blip, before it ever emails me.

Both alert types firing for real, not staged for this write-up:

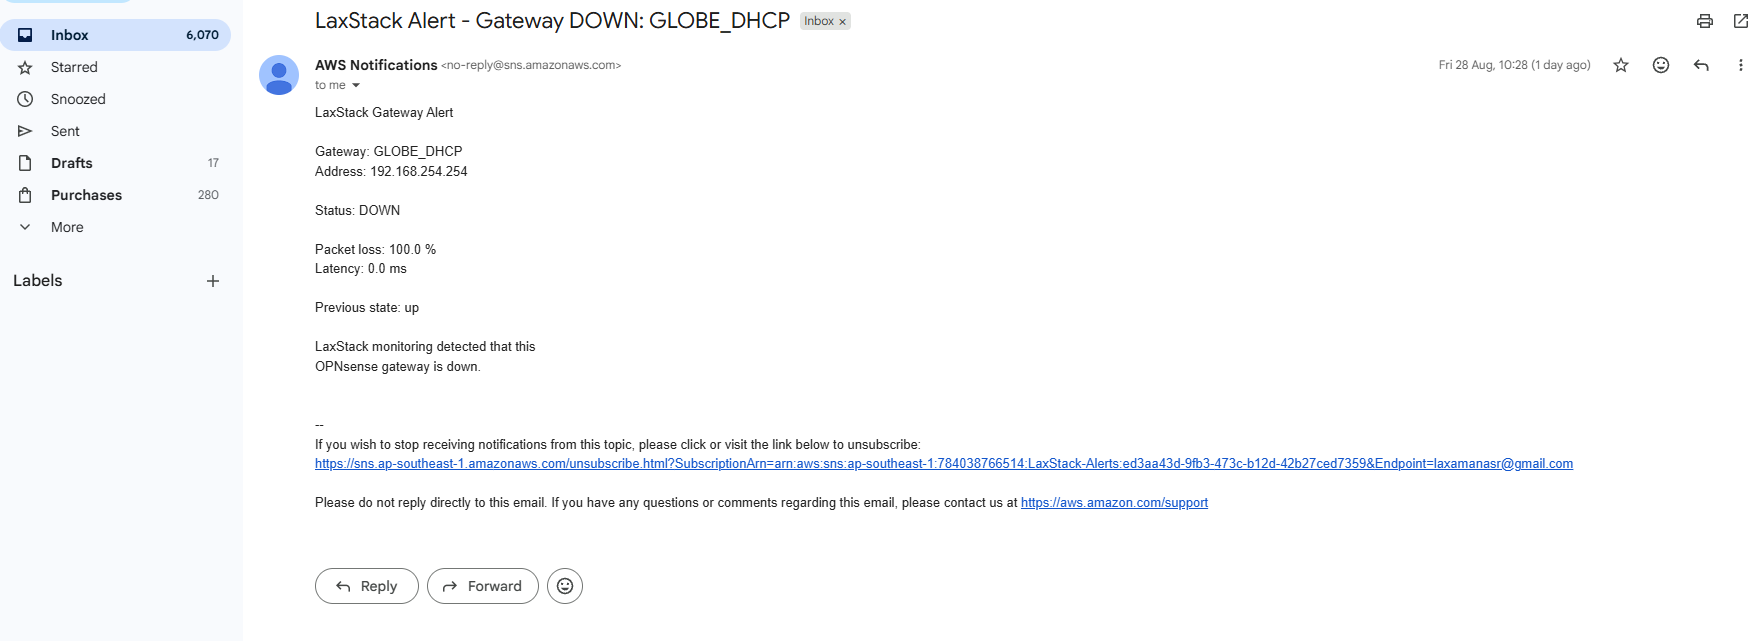
Email from AWS Notifications titled LaxStack Alert - Gateway DOWN: GLOBE_DHCP, showing the gateway address, 100% packet loss, and the previous state of up before this alert fired.
whatA real alert fired the moment GLOBE_DHCP flipped from up to down — packet loss, latency, and the previous state all included.
Email from AWS Notifications titled LaxStack Alert - OPNsense Unreachable, showing 2 consecutive failures and a raw URLError: urlopen error timed out from the monitor Lambda trying to reach the OPNsense API.
whatThe other failure mode: OPNsense's API stopped responding entirely. Note the raw URLError included — and that it waited for 2 consecutive failures, not one, before alerting.
tail -f debug.log

Follow the Debug: An OAuth Failure That Wasn't What It Looked Like

Documented because the fastest-looking fix was the wrong one twice in a row.

1

The Symptom

Every real sign-in attempt landed on Cognito's own /error?error=invalid_request page — even though AWS's own "View login page" button in the console worked perfectly. Same user pool, same app client, wildly different outcomes.

Cognito Managed LoginOAuth2 + PKCE
2

Isolating the Request

Rather than guess, I built a battery of curl tests hitting /oauth2/authorize and /login directly — adding scope, then state, then the PKCE code_challenge one at a time — to find the exact parameter that flipped a working request into a rejected one.

curlsystematic elimination
3

A Red Herring, Twice

Every single isolated test came back clean — the app client config, the PKCE shape, and the Managed Login branding were all correct by AWS's own documented rules. A theory about a stale browser cookie from an earlier broken branding style also tested out and got ruled out in an incognito window. The request that failed in the browser kept succeeding by hand.

ruled out configruled out stale session
4

The Real Evidence

The only way forward was to stop guessing and capture the browser's actual outgoing request via a HAR export. It revealed a client ID one character off from the real one — a zero where the real app client used the letter o — hardcoded into the frontend and invisible at a glance in a 26-character string.

HAR captureground truth beats theory
5

The Fix

One character corrected in the frontend's Cognito config, and the full PKCE flow completed end to end on the very next attempt.

resolved
show inventory

Technology Stack

Amazon CognitoAPI GatewayAWS Lambda (Python) Amazon DynamoDBAmazon SNSEventBridge Scheduler Amazon CloudFrontVPC EndpointsOAuth 2.0 / PKCE OPNsenseProxmox VEVanilla JS / HTML / CSS
show running-config | section future

Roadmap

Framed as maturity phases rather than a flat feature backlog.

PHASE 0

MVP current

Dual-tier dashboard live, Cognito PKCE auth working end to end, autonomous gateway alerting via EventBridge and SNS.

PHASE 1

Infrastructure as Code next

Move Lambda, API Gateway, and Cognito configuration into Terraform instead of manual console setup.

PHASE 2

Persistent Historical Metrics planned

Trend data currently lives only in the browser for the session — move it into DynamoDB or CloudWatch for real history.

PHASE 3

Slack / Teams Alert Delivery planned

Extend gateway alerting beyond email into chat, where I'm actually more likely to see it in real time.

PHASE 4

Broader Authenticated Routes planned

Extend the same Cognito-protected pattern to additional on-prem systems as the homelab grows.

show notes

Lessons Learned

#Isolating one OAuth parameter at a time beats guessing
#Reading a HAR file when curl keeps disagreeing with the browser
#Designing a product that's useful before login, better after
#Enforcing access tiers at the API layer, not just the UI
#State-based alerting to avoid paging myself every 3 minutes
#VPC Endpoints instead of a NAT Gateway for private AWS access
#Client-side event feeds built from real deltas, not fabricated data
#Matching a docs page's visual identity to the product it documents
×